Technology
- The modeling system
- The data
- The “hot-points”
- The alert thresholds
- The schedule
- Forecasts presentation
- Links
- References
The Modeling System
To predict riverflow many different methods may be used. In the past more often statistical methods were used for large river basins. Knowing the precipitations and the water levels in the upper part of the basin, with statistical approach were forecasted water levels in the lower part of the basin. Nowadays with the increasing intensive rain and respective flashflood frequencies this approach is no more suitable. Flashfloods occur for periods sometimes as short as one to three hours after the intensive precipitation is registered. Therefore we must if possible predict the event days before its happening. Here come to help numerical weather models that more or less successfully are predicting the precipitation intensity and location. When we feed a hydrological model with data coming from a forecasting meteorological model we can predict to some extend the water levels corresponding to the forecasted precipitation intensity and location. In this project we combine precipitation and air temperature data from the following weather forecast models: A. Regional scale short range ALADIN model—3 days ahead forecast; B. Global scale model - European Centre of Medium Range Forecast (ECMWF)—5 days ahead forecast.
The hydrological model usually deals with predefined amounts of runoff and drainage water that it routes through the river network until it reaches a river cross-section of interest (that we call “hot-point”) for which we compute the forecasted discharges. The computing of surface runoff and drainage per-unit area here is made by the surface scheme ISBA. ISBA (Interface Soil Biosphere Atmosphere) as other specific models is built into SURFEX—the Land and Ocean Surface Platform for the simulation of earth surface variables and fluxes (Fig. 1) developed by the scientific community lead by CNRM—Meteo-France. The hydrological model coupled with ISBA is a version of TOPMODEL that is based on the basin topography. The coupling was firstly developed for the simulation of fast floods in Mediterranean region in France. That makes the models suitable for the ARDAFORECAST project dealing with Mediterranean rivers too.
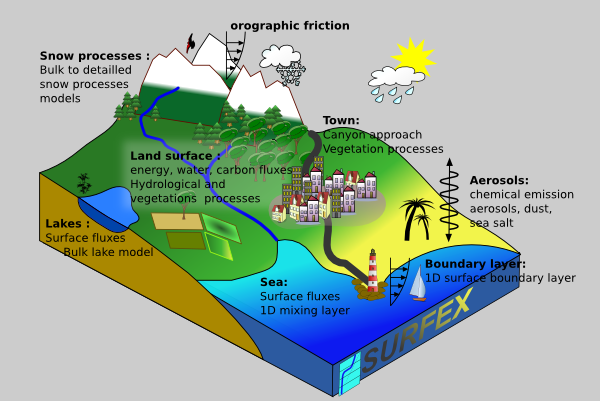
Fig. 1. Schematic view of the modelling system SURFEX (http://www.cnrm.meteo.fr/surfex)
TOPMODEL that is integrated into SURFEX computes the discharges at each point of interest. The computed discharges are converted in levels above mean sea level (AMSL) to be able to compare them with the predefined local “hot-point” profiles. This is done using hydraulic formulae for each “hot-point” cross-section. Both the discharges and levels are compared to the so called “alert thresholds”. For the town of Smolyan more detailed approach is used. Firstly a static set of hydraulic scenarios is prepared with HEC-RAS for discharges with different return periods. Then the computed TOPMODEL discharges for Smoyan’s rivers Cherna and Bjala are compared to the specific return period scenarios. This permits to provide more detailed forecasting information on flooded areas in the town (Fig. 2)
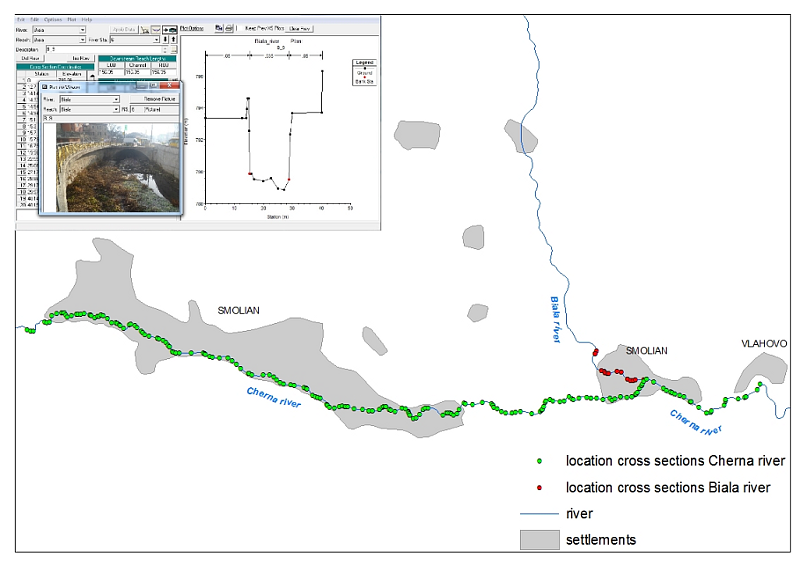
Fig. 2. Scheme of the zone for hydraulic modeling—Smolyan
To compute the forecasted outflows from the big reservoirs of Arda river reservoir cascade a water balance method is used. Knowing the initial water storage (and the capacities) of the reservoirs and the forecasted inflows into each of them, considering a statistically determined power plant outflow, we can estimate the eventual total outflow and/or overflowing of each of them.
In order to reduce the accumulation of errors due to the forecasted precipitation and air temperature data the models have to be initialized with enough long data series with measured data. This data is coming from the network of telemetric meteorological and hydrological stations in near real time (every hour).
The Data
The ISBA-TOPMODEL modeling system needs some static physiographical data. Most of the data for the earth surface is predefined in global databases: 1km altitudes and topographical index, soil and vegetation properties (land cover). In some specific cases soil properties (root depth, sand and clay fractions) may be changed to improve modeling results. On the other hand TOPMODEL uses more detailed topographical information with a resolution of 50 m or 100 m. That is used to define the relationship between ISBA grid and the river network—e.g. how fast and in which direction the runoff and drainage waters reach the river, and finally the “hot-point” cross-section. An example of such information is the “elevation” map of the Arda River basin upstream from Kitnitsa village near Kardzhaly reservoir with resolution of 50 m (Fig. 3) and the “river streams” map (Fig. 4).
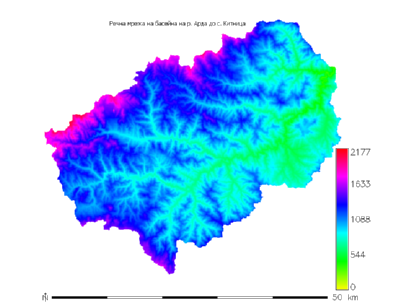
Fig. 3. “Filled elevation” map of Arda river |
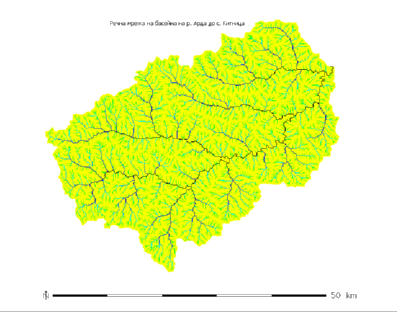
Fig. 4. “Streams” map of Arda river |
Meteorological data used by ISBA to compute the evapo-transpiration, the runoff and the drainage per unit area includes: liquid and solid precipitations, air temperature and moisture, wind speed, solar and atmospheric radiation. It can be provided from meteorological forecasting models or from automatic telemetric stations. Scattered data is interpolated in regular grid form over the Arda river basin with a time step of 3 h and spatial step of 8km (Fig. 5, 6).
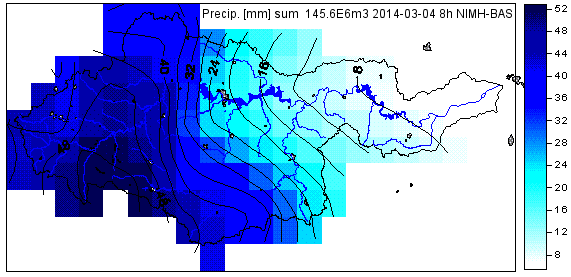
Fig. 5. Interpolation of the daily accumulated precipitation [mm] over the Arda River basin
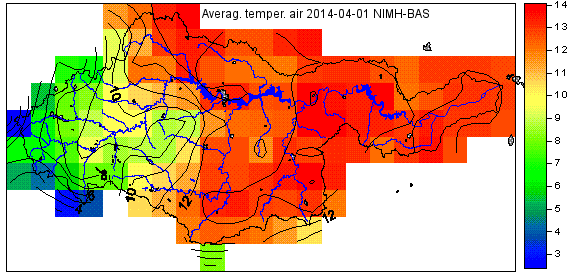
Fig. 6. Interpolation of the daily average temperature [°C] over the Arda River basin
Data from the river hydrometric stations installed within the project is published at the web site. Some of these stations data series were used for model’s calibration, e.g. data from the stations on Varbitsa River near Balabanovo (Gruevo) and on Arda River near Vehtino village (Fig. 7). These two stations data shows the timing and amplitude of the high waves on the main Arda tributaries. Stations on smaller but dangerous tributaries like Bjala in Smoljan and Elhovska at Rudozem are shown too as well as the water outflow from Ivaylovgrad dam near the border between Bulgaria and Greece.
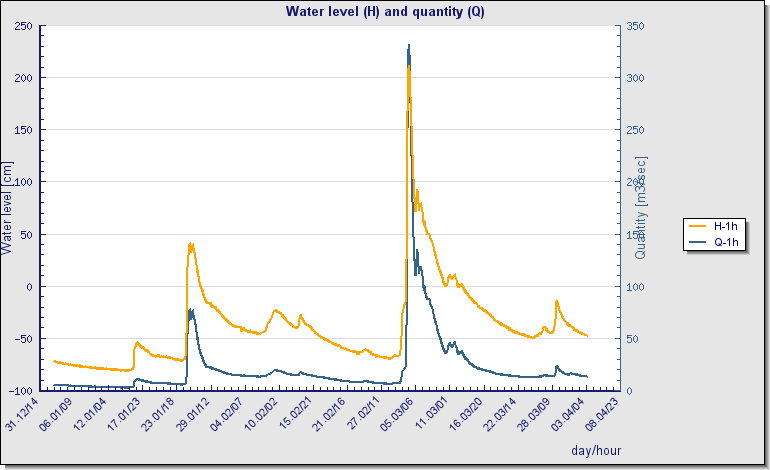
Fig. 7. Hourly data series of water levels and streamflow discharges [m3/s] of Arda River at Vehtino
The "Hot-points"
An assessment of the locations (settlements) where historical inundation events are recorded was done within the “Preliminary risk assessment plan” preparation–according to EU directive 2007/60. According to that plan consultations with the regional authorities and civil protection units showed the places were an appropriate flood forecast will be made. For these locations cross-section profiles were measured, hydraulic and hydrologic models were prepared. A map of the “hot-points” and the related endangered areas in Arda basin is given at Fig. 8. Special attention is made to produce warnings associated to reservoirs overflowing that may cause danger for the riparian zones below reservoirs in Bulgaria and Greece. That’s because two “hot-points” lay after the dam of “Studen Kladenenets” and of the dam of “Ivaylovgrad” at the Bulgarian-Greek border (right side at Fig. 8).
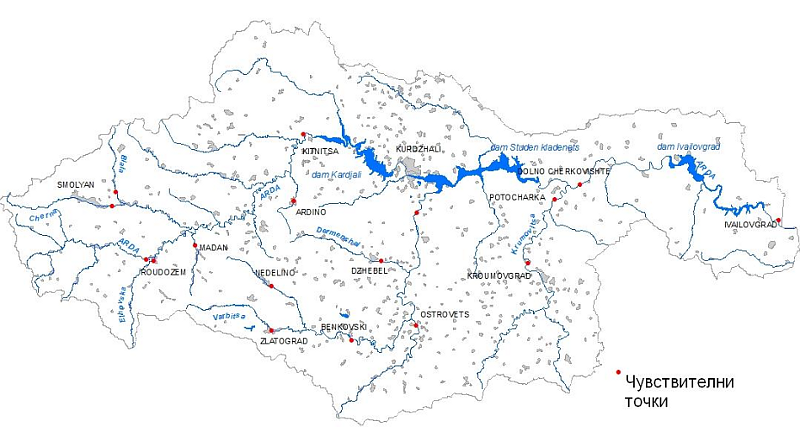
Fig. 8. A map of endangered areas within Arda basin in Bulgaria with the “hot-points”
Hot-points in Greece are shown on the picture from “Goggle Earth” (Fig. 9) (Thanks to Mr. Christos Partsias). Those are from left to right: a. Kiprinos-Komara Bridge; b. Elia-Fylakio Bridge; c. Kastanies flood plain near Egnatia Bridge; d. Irish Crossing at Kastanies. On the same picture you can see on the right the Greek-Turkey border passing near Maritsa/Evros River (marked with yellow line) and in the lower-left corner the Bulgarian-Greek border.
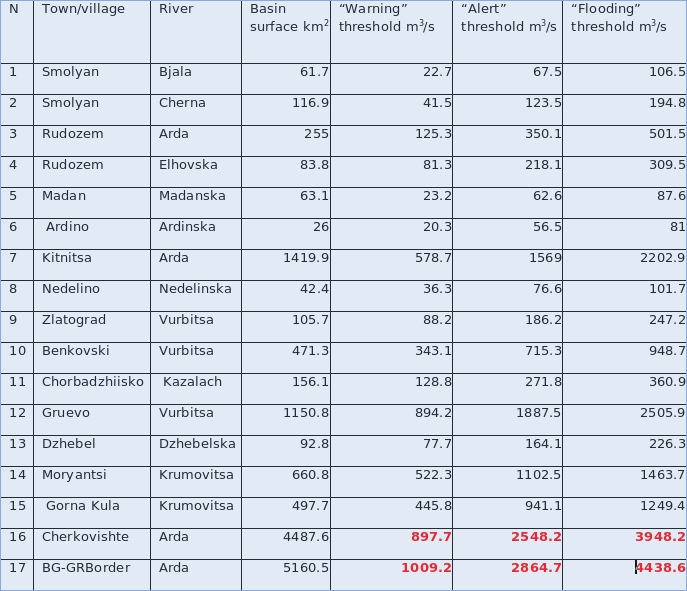
Table. 1. Parameters of “Hot-point’s” on Bulgarian territory
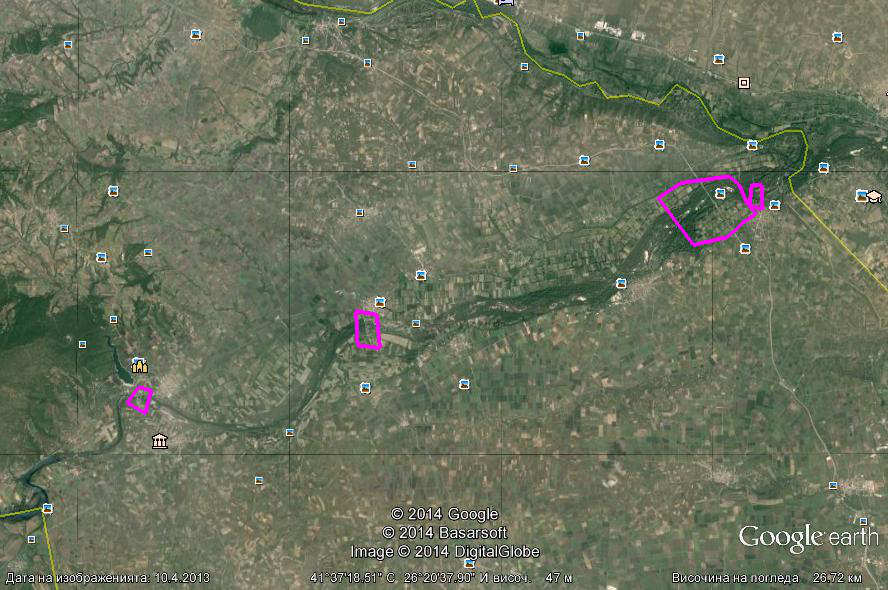
Fig. 9. A satellite image of the endangered areas within the Arda basin in Greece (credits: Christos Partsias)
The Alert Thresholds
Discrimination between safe stream-flow discharges (and water levels) and those that create danger for the riparian zone is made by two distinct methods: the first one relies on the statistical approach and the second on local infrastructure. We consider only the yearly maximums of the water discharge at certain point of the river. When the statistically computed discharge has a return period (or repeatability) once every 100 years, it has 1% probability. According to the statistical theory discharges bigger than the 1% probability discharge are very dangerous for the riparian zone settlements. Next levels below the 1% are 5% (every 20 years) and 50% (every second year). The second approach is evaluated in relation with the human infrastructure around the river. There are for instance bridges, dikes or temporary shelters near to the river that could be endangered with stream flow discharges even below the 50% probability limit.
The three “alert thresholds” are soft limits computed depending on the basin area and regional hydrological statistics. To do that the “method of regionalization” was used. These limits can be adjusted according the local infrastructure. The 3 limits (Table 1) are between the “safe zone” (in green), the “warning zone” (in yellow), the “risk of flooding” zone (in orange) and the “flooding zone” (in red color) (e.g. cells are colored yellow when 50% probability discharge is exceeded) (Fig. 10). At (Tab. 1) the last 2 rows show the “natural” thresholds at locations after the dam of “St.Kladenets” and “Ivaylovgrad”. “Natural” means without taking into account the retention and storage capacity of the Arda River reservoir cascade. As the reservoirs heavily reduce the high flow peaks determination of the thresholds after big reservoirs is an iterative process. We should take into account many factors including the “natural” thresholds.
The Schedule
The modeling system is initialized with data series of measured data. Only data to simulate five days ahead after “today” is coming from meteorological forecasting models. As the computing time is relatively short we have to produce new initialization files (so called “hot-start”) every two months. So the first automated step is to gather all the information of “real-time” telemetric stations, to mix it with the traditional station’s data in order to produce gridded data (Fig.5, 6) of the needed variables: precipitations, air temperature, etc. This is done about 9:30 to 10:00 o’clock.
From modeling point of view firstly forecasted discharges in m3/s with time step 3h are computed at the selected “hot-points” (Table 1) up-to 5 days ahead. This is done twice a day before 11:00 and respectively 23:00 following the forecasting meteorological models that have an output in the morning and in the evening. From these stream-flow discharges are computed the corresponding water levels (and above sea elevations). The specific alert levels of the “hot-points” are coming from the comparisons of the previous step results with the statically determined alert thresholds.
Forecasts Presentation
As flood forecasts are computed twice a day 5 days ahead for a given hour within the next days theoretically we could accumulate up-to 10 different forecasts. Forecasts are differing because of changing initial conditions. As we are approaching the forecasted event, for instance an intensive precipitation the flood forecasts move slightly as values and/or in the time-space. Therefore we can analyze the move of the produced alert levels with the time. At the web site the 10 successive forecasts are shown in separate rows from the bottom to the upper row. The newest forecast (that goes five days ahead from today) is in the second row and in the first row are the discharge values computed with measured (not forecasted) data: precipitations, air temperature, etc. Each cell’s color represents a 3h discharge value’s “alert level”. By this way there are 8 cells per day. Day’s dates are shown on the heading row. At Fig. 7 by 20:00 to 23:00 the yellow colored cells show that for 6 hours stream-flow discharges in Zlatograd were forecasted to be in “warning zone” alert level.
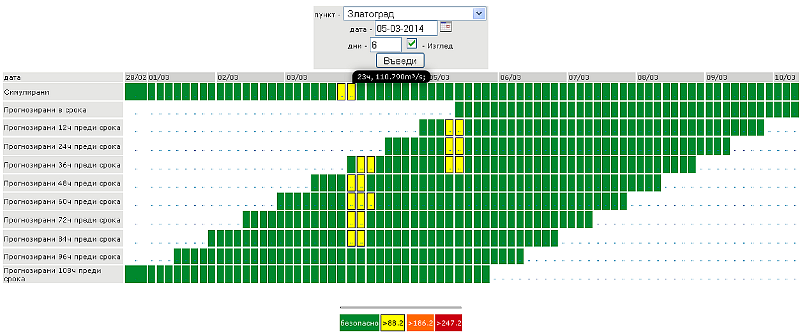
Fig.10. Presentation of the flood forecast for the “hot-point” Zlatograd at 5-03-2014.
The above flow forecast presentation is accessible through the projects web site using two approaches: a tree view of the “hot-points” and a map interface (Fig. 11)
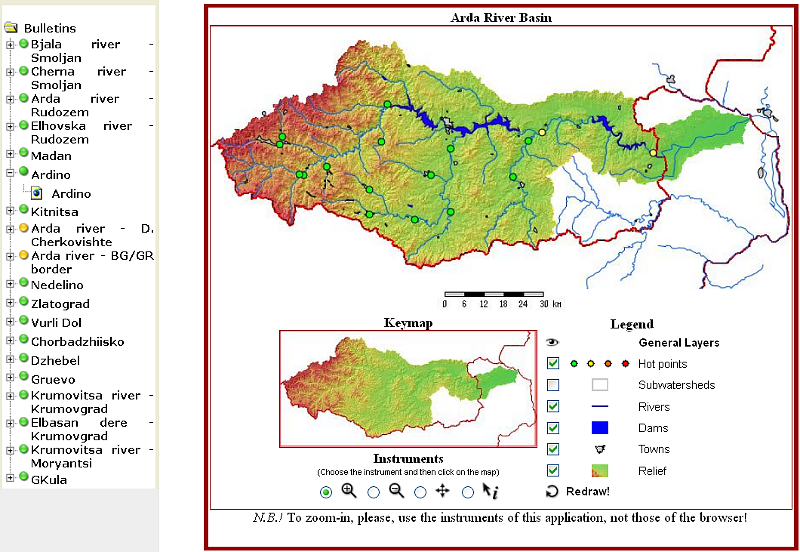
Fig. 11. Web interface for the “Flood forecast on the hot-points locations”
Links
- ECMWF
- http://www.ecmwf.int
- ALADIN
- http://www.cnrm.meteo.fr/aladin/
- SURFEX+ECOCLIMAP
- http://www.geosci-model-dev.net/6/929/2013/gmd-6-929-2013.html
http://www.cnrm.meteo.fr/surfex/
http://www.geosci-model-dev.net/6/563/2013/gmd-6-563-2013.html
- ISBA-TOPMODEL
- http://hal.archives-ouvertes.fr/docs/00/59/53/55/PDF/these_complet_sansart.pdf
http://www.cnrm-game.fr/spip.php?article274
http://www.cnrm-game.fr/spip.php?rubrique180
- HEC-RAS
- http://www.hec.usace.army.mil/software/hec-ras/
References
Beven K. and Kirkby M.J., 1979 : A physically based, variable contributing area model of basin hydrology. Hydrol. Sci. Bull., 24, 43-69.
-------
Bouilloud, L., K. Chancibault, B. Vincendon, V. Ducrocq, F. Habets, G.-M. Saulnier, S. Anquetin, É. Martin, J. Noilhan, 2009 : Coupling the ISBA land surface model and the TOPMODEL hydrological model for Mediterranean flash-flood forecasting : Description, calibration and validation. Journal of Hydrometeorology, 11(2), 315-333
-------
Delrieu, G., V. Ducrocq, E. Gaume, J. Nicol, O. Payrastre, E. Yates, P.-E. Kirstetter, H. Andrieu, P. A. Ayral, C., Bouvier, J. D. Creutin, M. Livet, A. Anquetin, M. Lang, L. Neppel, C. Obled, J. Parent-du-Chatelet, G.-M. Saulnier, A. Walpersdorf, and W. Wobrock, 2005 : The catastrophic flash-flood event of 8-9 September 2002 in the Gard region, France : a first case study for the Cévennes-Vivarais Mediterranean Hydro-meteorological Observatory. J. Hydrometeorology, 6, 34-52.
-------
Habets F., J. Noilhan, C. Golaz, J.-P. Goutorbe, P. Lacarre`re, E.Leblois, E. Ledoux, E. Martin, C. Ottle and D. Vidal-Madjar, 1999: Implementation of the ISBA surface scheme in a distributed hydrological model applied to the Hapex-Mobilhy area. Part II: simulation of streamflows and of annual water budget, J. Hydrol., 217, 97-118.
-------
Noilhan, J. and S. Planton, 1989: A simple parameterization of land surface processes for meteorological models. Mon. Weather Rev., 117, 536-549.
-------
Vincendon B., Ducrocq V., Saulnier G.M. ; Bouilloud L., Chancibault K., Habets F., Noilhan J., 2010 : Advantages of coupling the ISBA land surface model with a TOPMODEL hydrological model dedicated to Mediterranean flash floods, Journal of Hydrology, doi:10.1016/j.jhydrol.2010.04.012.
-------
Vincendon B., Bouilloud L., Chancibault K., Saulnier G.-M., Ducrocq V., Habets F., Martin E., Noilhan J., 2007 : Flash-flood forecasting with the SURFEX/TOPMODEL coupled system
9th PLINIUS Conference on Mediterranean Storms, Varenna : Italie